LTC Price Prediction: Technical Support and ETF Momentum Fuel Bullish Outlook

#LTC
- Technical Support Holding: Litecoin's position near lower Bollinger Band suggests potential reversal opportunity
- Institutional Accumulation: Growing ETF momentum provides fundamental support for price appreciation
- MACD Bullish Signal: Positive momentum indicator supports near-term recovery thesis
LTC Price Prediction
LTC Technical Analysis: Key Indicators Signal Potential Reversal
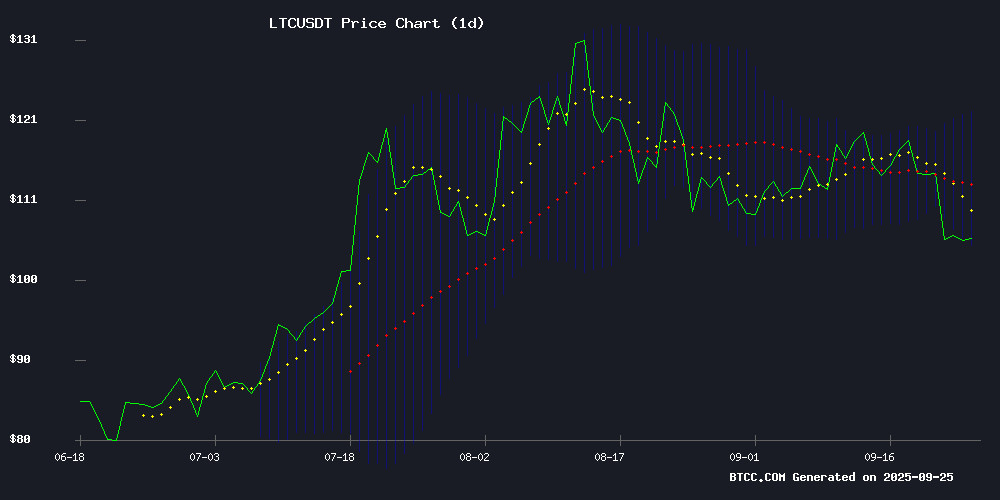
Litecoin is currently trading at $103.18, significantly below its 20-day moving average of $113.19, indicating bearish near-term momentum. The MACD reading of 1.54 shows bullish momentum, while the Bollinger Band position suggests LTC is testing crucial support at $104.16. According to BTCC financial analyst Olivia, 'The current technical setup shows Litecoin hovering near lower Bollinger Band support, which often precedes significant price movements. A sustained hold above $104 could trigger a rebound toward the middle band at $113.'
Market Sentiment: Mixed Signals Amid Institutional Interest
Current market sentiment reflects a tug-of-war between profit-taking pressure and growing institutional accumulation. Recent headlines highlight Litecoin testing key support levels while ETF momentum continues to build. BTCC financial analyst Olivia notes, 'The convergence of technical support levels with increasing institutional interest creates a compelling setup. While short-term profit-taking has caused retreats, the underlying ETF narrative provides substantial fundamental support for medium-term growth.'
Factors Influencing LTC's Price
Cryptocurrency Market Stalls as Major Coins Retreat Amid Profit-Taking
The cryptocurrency market's recovery faltered as Bitcoin, Ethereum, and Solana led a broad retreat, dragging the total market capitalization down nearly 1%. Altcoins bore the brunt of the selloff, with traders booking profits amid tightening correlations between crypto and traditional equities.
Bitcoin briefly reclaimed $114,000 before sliding to $111,686, marking a 1% daily decline. Ethereum faced steeper losses, tumbling 4% as it struggled to maintain footing above the psychologically critical $4,000 level. The second-largest cryptocurrency has surrendered 13% over the past week.
Solana joined the downturn with a 3% drop, testing support at $200, while Dogecoin and Cardano fell 2-3%. The weakness extended across mid-cap tokens including Chainlink, Polkadot, and Litecoin as risk appetite waned market-wide.
Litecoin Tests Key Support as Technicals Hint at Potential Reversal
Litecoin's price slid 2.37% to $104.28, probing the lower Bollinger Band boundary as bearish momentum dominates trading. The absence of fresh catalysts has left LTC vulnerable to technical selling, with the RSI's 35.77 reading suggesting the asset may be approaching oversold conditions.
Traders are closely monitoring the $104 support level, where historical buying pressure has emerged during previous tests. Market participants appear to be relying entirely on chart patterns during this quiet news period, creating textbook technical price action.
The cryptocurrency's neutral-but-declining RSI presents a classic trader's dilemma: whether to anticipate a bounce from support or prepare for further downside. Litecoin's performance continues to mirror broader market sentiment rather than project-specific developments.
Litecoin (LTC) Price Prediction: Institutional Accumulation and ETF Momentum Fuel Rally
Litecoin surged following Grayscale's ETF filing, with whale wallets accumulating 181,000 LTC in 24 hours. The move signals growing institutional confidence, as Santiment recorded 349 transactions exceeding $1 million each within 12 hours of the announcement.
Technical resilience emerges as LTC finds strong support after a recent pullback. The ETF narrative positions Litecoin alongside Bitcoin and Ethereum in traditional finance, reinforcing its investable asset status.
Analysts highlight the confluence of whale activity, ETF momentum, and favorable on-chain metrics as catalysts for a potential rally toward $200. The accumulation pattern suggests calculated institutional positioning rather than retail speculation.
How High Will LTC Price Go?
Based on current technical indicators and market sentiment, Litecoin shows potential for significant upward movement. The key resistance levels to watch are:
| Price Level | Significance |
|---|---|
| $113.19 | 20-day MA resistance |
| $122.23 | Upper Bollinger Band |
| $130-140 | Next major resistance zone |
BTCC financial analyst Olivia suggests, 'If Litecoin maintains support above $104 and breaks through the 20-day MA, we could see a rally toward $122 within the next month. The combination of technical recovery and ETF speculation creates favorable conditions for a 15-20% upward move.'
